


Всі публікації



Hidden Manipulations by Well-Known Global Indices
Economic development indices are not just a tool for analysis, but can sometimes be a powerful weapon of manipulation. We examine how global rankings are being used as a tool to advance the interests of those who advocate for expanding state influence. Four well-known indices — under the ILI microscope.
11 July, 2026
World Indexes & Rankings
Share
Indices used to measure economic development can serve not only as guides but also as tools for manipulation to shape the desired public sentiment. This is an unpleasant truth that we must accept as we examine this important study by the International Liberty Institute (ILI).
We will examine four well-known global indices to show, through their example, how politicians, with the help of captive think tanks, have learned to use this important component of economic and institutional analysis to advance their own vested interests. In this case, propaganda clichés are presented as scientific research tools. Instead of valid scientific knowledge and information verified by both theory and practice, harmful ideological agendas are promoted.
Signs of Unscientific Indices
At the end of the 20th century, in addition to standard macroeconomic indicators (GDP, inflation, unemployment, exports/imports, trade, balance of payments, budget deficit, etc.), a wide variety of research and analytical centers and international organizations began to develop and propose various indices. They aimed to help politicians and society at large better navigate the selection of models and strategies for the country’s development, as well as tools for shaping economic policy. According to the authors, indicators such as economic growth rates, labor productivity, per capita income, wage levels, the value of household assets, and life expectancy are no longer sufficient for formulating sound economic policy, and several additional indicators need to be included. But they all shared one characteristic — a hidden ideological slant.
These indices represent what is known in English as “science-ish” — a construct; that is, in terms of form and vocabulary, they give the impression of being scientific, but in essence — in terms of the methodology used to develop and calculate the numerical indicator, as well as the conclusions drawn by their authors — they are unambiguously tools for supporting and promoting certain ideologemes.
Essentially, they serve as a form of coercion or a “nudge” (a gentle push or encouragement to prompt a person to make a certain decision) for politicians to promote a specific economic policy. Specifically, this involves expanding the public sector in industry, finance, health care, and education, as well as in the labor market and foreign economic policy. This approach involves discriminating against certain business entities and types of activities while favoring others, creating special conditions for them in the name of a wide variety of noble goals: ensuring sustainable development, social progress, supporting harmonious human development, ensuring gender equality, developing high technology, fostering a balanced labor market, and so on.
Human Development Index and Social Progress Index
Let's start with the best-known index, which was introduced in 1990, in which its authors suggested focusing on the state of education, health care, and equality. That’s how the UN’s Human Development Index came to be. It was developed by Pakistani economist Mahbub ul-Haq based on the theoretical works of Amartya Sen. It was a UN assessment tool developed by M. ul-Haq during his tenure as Special Advisor to the Administrator of the United Nations Development Programme.
This index aggregates a wide variety of indicators related to health, education, literacy, income, and life expectancy at birth. Later, the methodology for assessing human development was expanded to include the factor of socioeconomic inequality, the Gender Inequality Index, and the Multidimensional Poverty Index. The UN actively uses this tool as purported scientific validation of its stated theory of development through a model of the state based on universal interventionism.
In the 2025 report, the top countries on the Human Development Index were Iceland (1st), Norway (2nd), Switzerland (3rd), Denmark (4th), Germany (5th), Sweden (5th), Australia (7th), Hong Kong (8th), the Netherlands (9th), and Belgium (10th).
The UAE (15), Saudi Arabia (37), Argentina (47), Oman (50), Georgia (57), and Kazakhstan (60) rank quite high.
Even Nazi Russia (64th), totalitarian Belarus (65th), and Armenia (69th) found themselves in the group of countries with very high levels of human development.
Ukraine ranked 87th in the 2025 index. We were surpassed by China (78), Azerbaijan (81), Iran (75), and Moldova (86). In terms of its index score, Ukraine (0.750) is very close to Cuba (97th place, 0.687).
Based on the composition of the index and the content of UN reports, it can be concluded that the optimal path for human development lies through the state and its active use of monetary, fiscal, regulatory, and social policy tools. Furthermore, in the context of the development of modern technologies, the authors of reports on human development and the corresponding index recommend that the State pursue an active industrial and innovation policy, which, under the leadership of and with the participation of high-ranking officials, should ensure gender and property equality, sustainable development, and a high level of technological production. What we have here is a typical example of pseudoscientific quackery, which consists of amassing a wide variety of data, aggregating it into a single index, and drawing corresponding ideological conclusions and recommendations.
UN experts do not concern themselves with establishing clear cause-and-effect relationships when assessing the impact of various factors on economic development and growth. In none of their reports do they assess — based on either theoretical or statistical data — the state’s failures. Factors such as “economic freedom,” “private property,” “quality of public administration,” “the displacement of private capital by state capital,” or “regulatory burden” are not taken into account. For more than 35 years, the UN has been promoting its Human Development Index based on flawed scientific foundations and crude, overly aggregated indicators. In essence, they serve as a smokescreen for the politicization of the economy and the ideologization of the UN’s capital allocation.
The Social Progress Index, developed by the nonprofit organization Social Progress Imperative, has become a unique conceptual variation on the UN’s Human Development Index. Its authors have brought together 57 indicators of social and environmental progress under a single Index umbrella. They are divided into three major categories:
- Basic human needs (access to basic health care, food, water, housing, and personal safety).
- The foundations of well-being (access to basic knowledge, information, and communication, as well as indicators of health and the state of the environment).
- Opportunities (human rights protection, personal freedom and choice, inclusivity, and access to higher education).
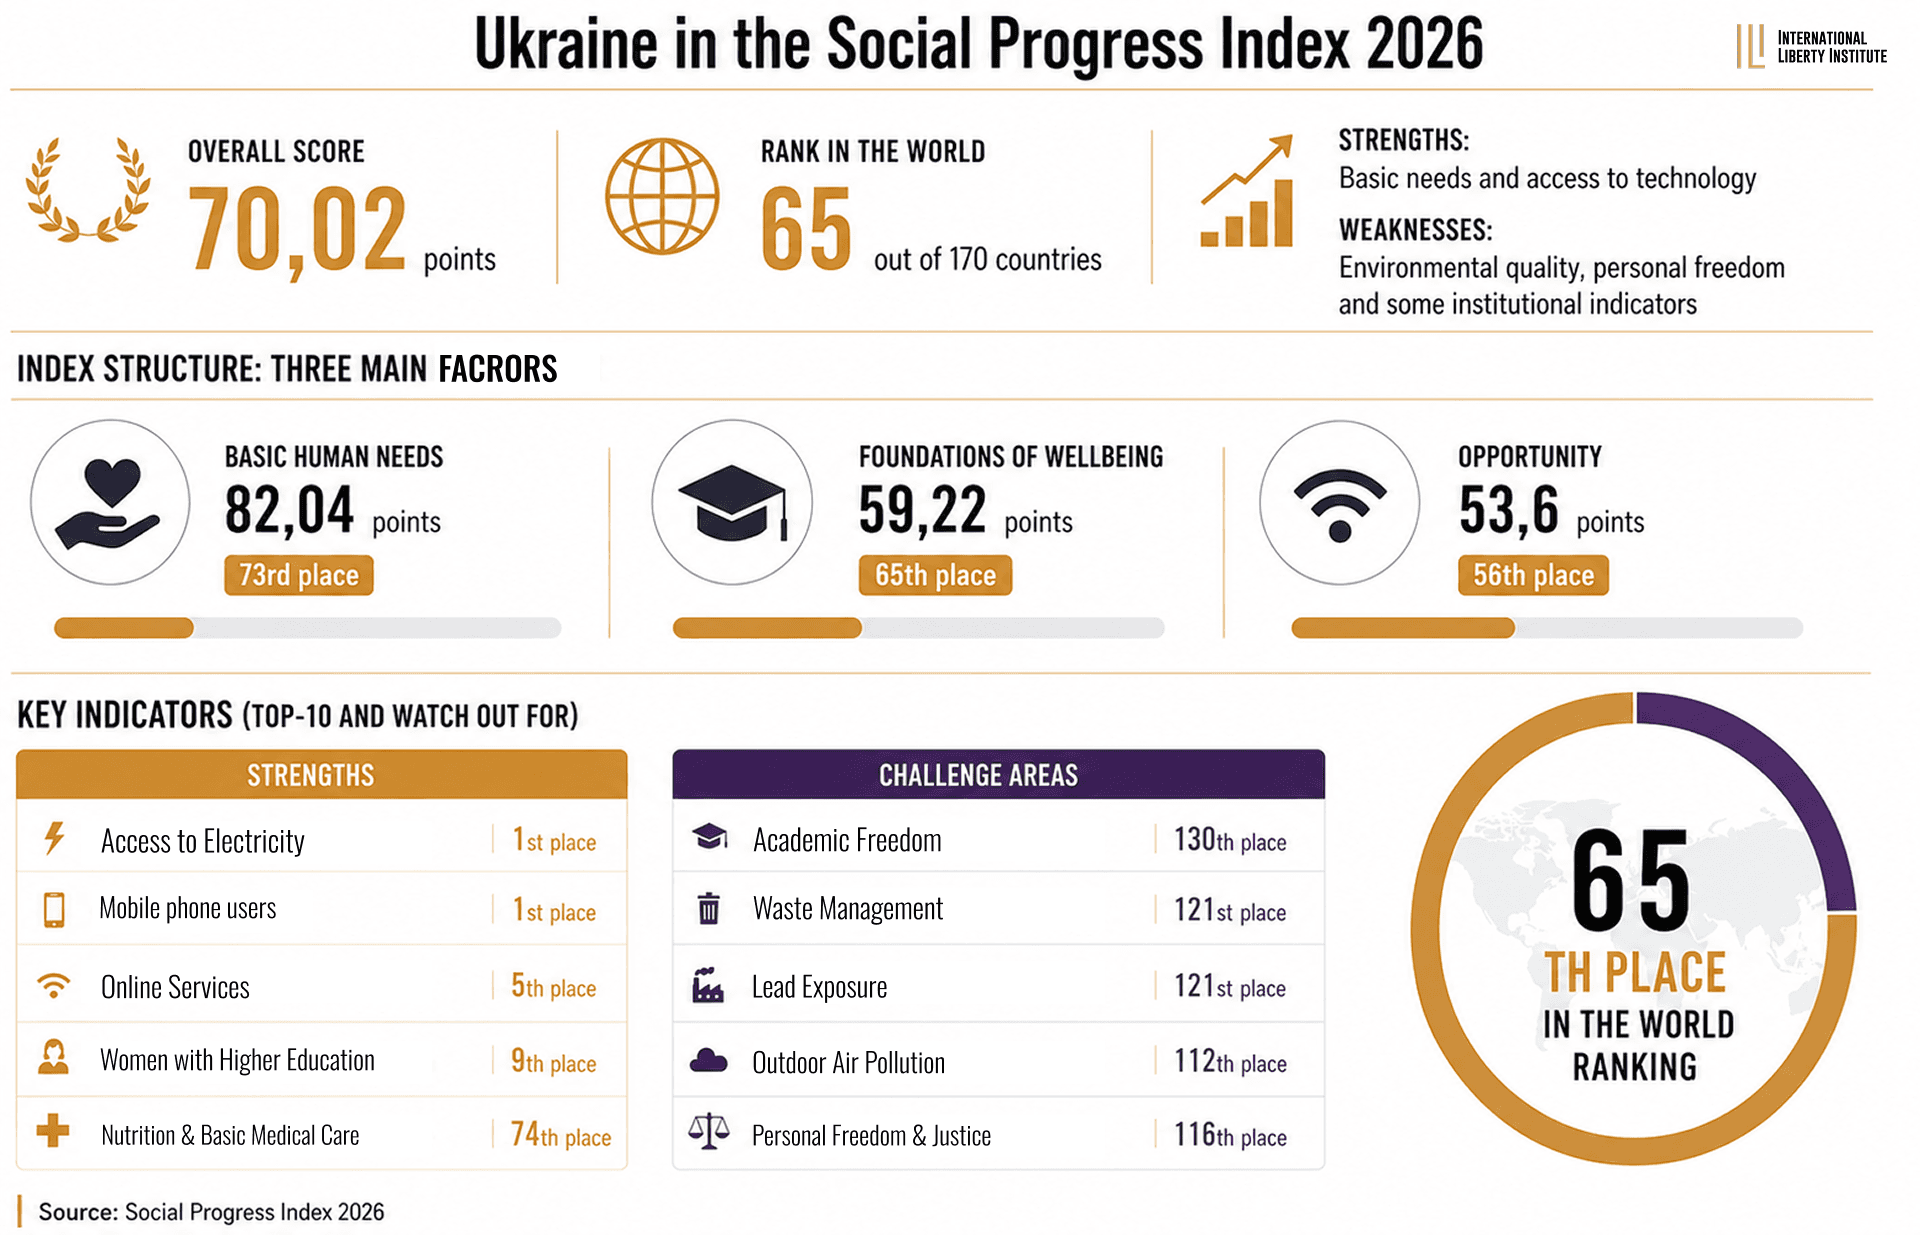
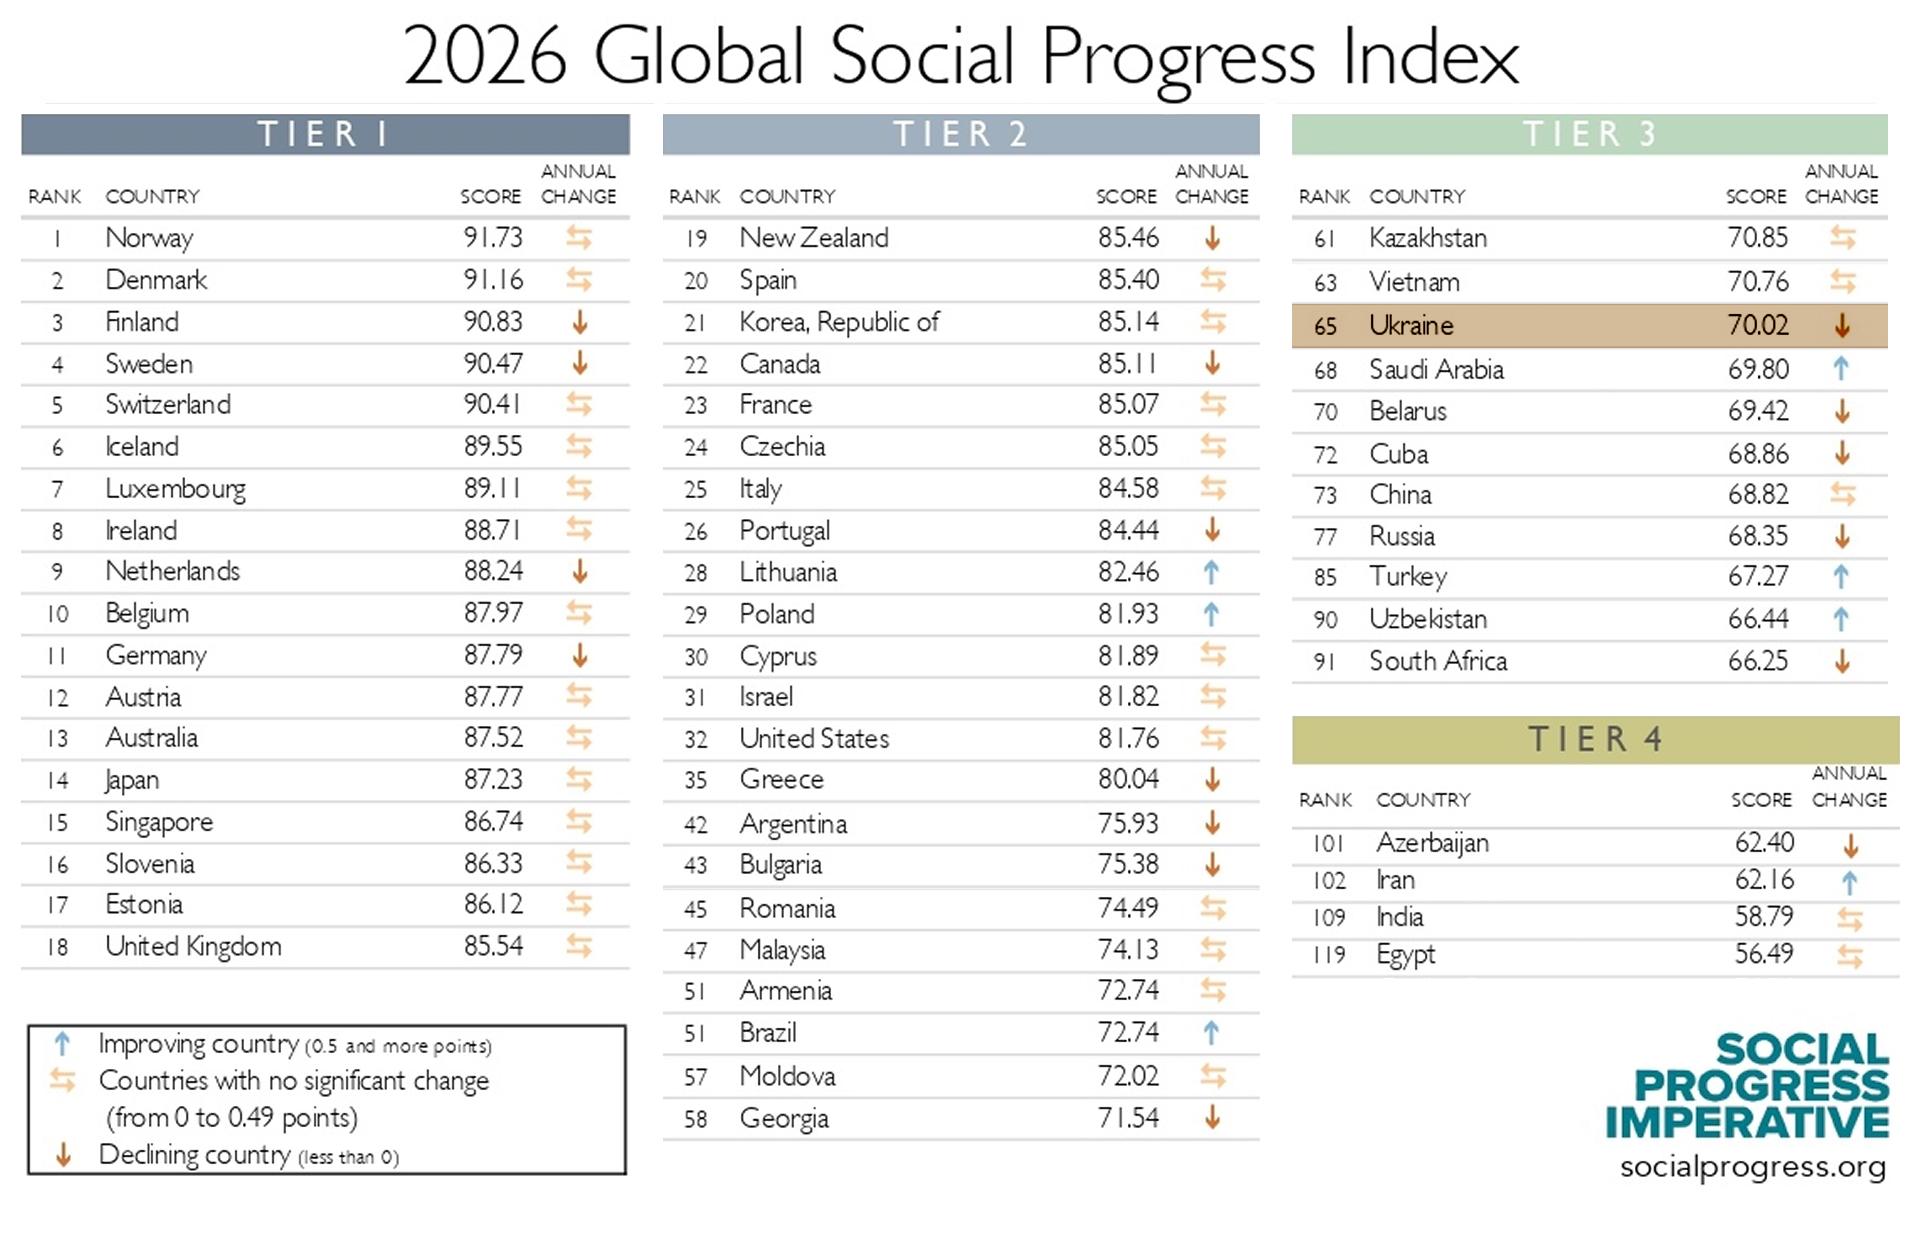
In the 2026 Social Progress Index, Ukraine ranked 65th with an index score of 70.02 points.
- In the first year of the survey, 2011, Ukraine ranked 71st with a score of 63.25 out of a possible 100 (its best result to date).
- In 2015, it dropped to 78th place (64.75).
- In 2021, Ukraine ranked 62nd (70.03).
The combination of such diverse factors makes it impossible to establish clear cause-and-effect relationships or to formulate recommendations based on scientific conclusions rather than on ideological, situational, or contextual preferences.
In the "basic needs" category, Ukraine has a score of 82.04 and ranks 73rd in the world.
We rank quite high in the “food and medical care” category (74th place) and in maternal mortality (98.1 points), and we also score high in “water supply and sanitation” and “housing.” In terms of access to electricity and the number of mobile phone users, Ukraine has a score of 100 and ranks first in the world alongside dozens of other developed countries; in the online services index, it ranks fifth in the world with a score of 98.54.
High scores were recorded in “household pollution” (99.13 points and 74th place) and “information and communication” (18th place globally with a score of 88.74 points).
However, while the factors “higher education,” “women with higher education,” and “expected years of higher education” ranked highly, the “academic freedom” indicator ranked 130th (27.7 points).
In the “Opportunity” category, Ukraine scored 59.22 points, ranking 65th; in “Equality Before the Law and Personal Freedom,” it ranked 116th; in “Political Rights,” it ranked 82nd; and in “Freedom to Make Life Choices,” it ranked 114th. Within this group of factors, the following stand out: “tolerance toward gays and lesbians” (Ukraine ranks 72nd), “early marriage” (66th), and “job insecurity” (51st).
When a single aggregate indicator — the Social Progress Index — is the sum of dozens, and sometimes even hundreds, of such diverse and unrelated indicators and factors, it has very limited scientific validity. Amid the cacophony of dozens of parameters, it is impossible to establish cause-and-effect relationships or formulate scientifically sound recommendations whose implementation by policymakers would ensure the country’s steady progress toward freedom, improvements in the quality of public administration, and greater well-being and prosperity. A particular challenge is combining, even within a single factor, absolute indicators (for example, the number of mobile phone users, child mortality, early marriages, life expectancy after age 65), indices (press freedom index, corruption perceptions index), and expert judgments and assessments (political rights, quality of universities, freedom of peaceful assembly).
The Social Progress Index, like the Human Development Index, is an ideological and propaganda tool of the theory and practice of universal interventionism.Share
The results obtained and the index values allow totalitarian and authoritarian countries and their ideologues to claim that their models offer a better social safety net and a more responsible approach to the environment than those of capitalist, democratic countries in the West. Example:
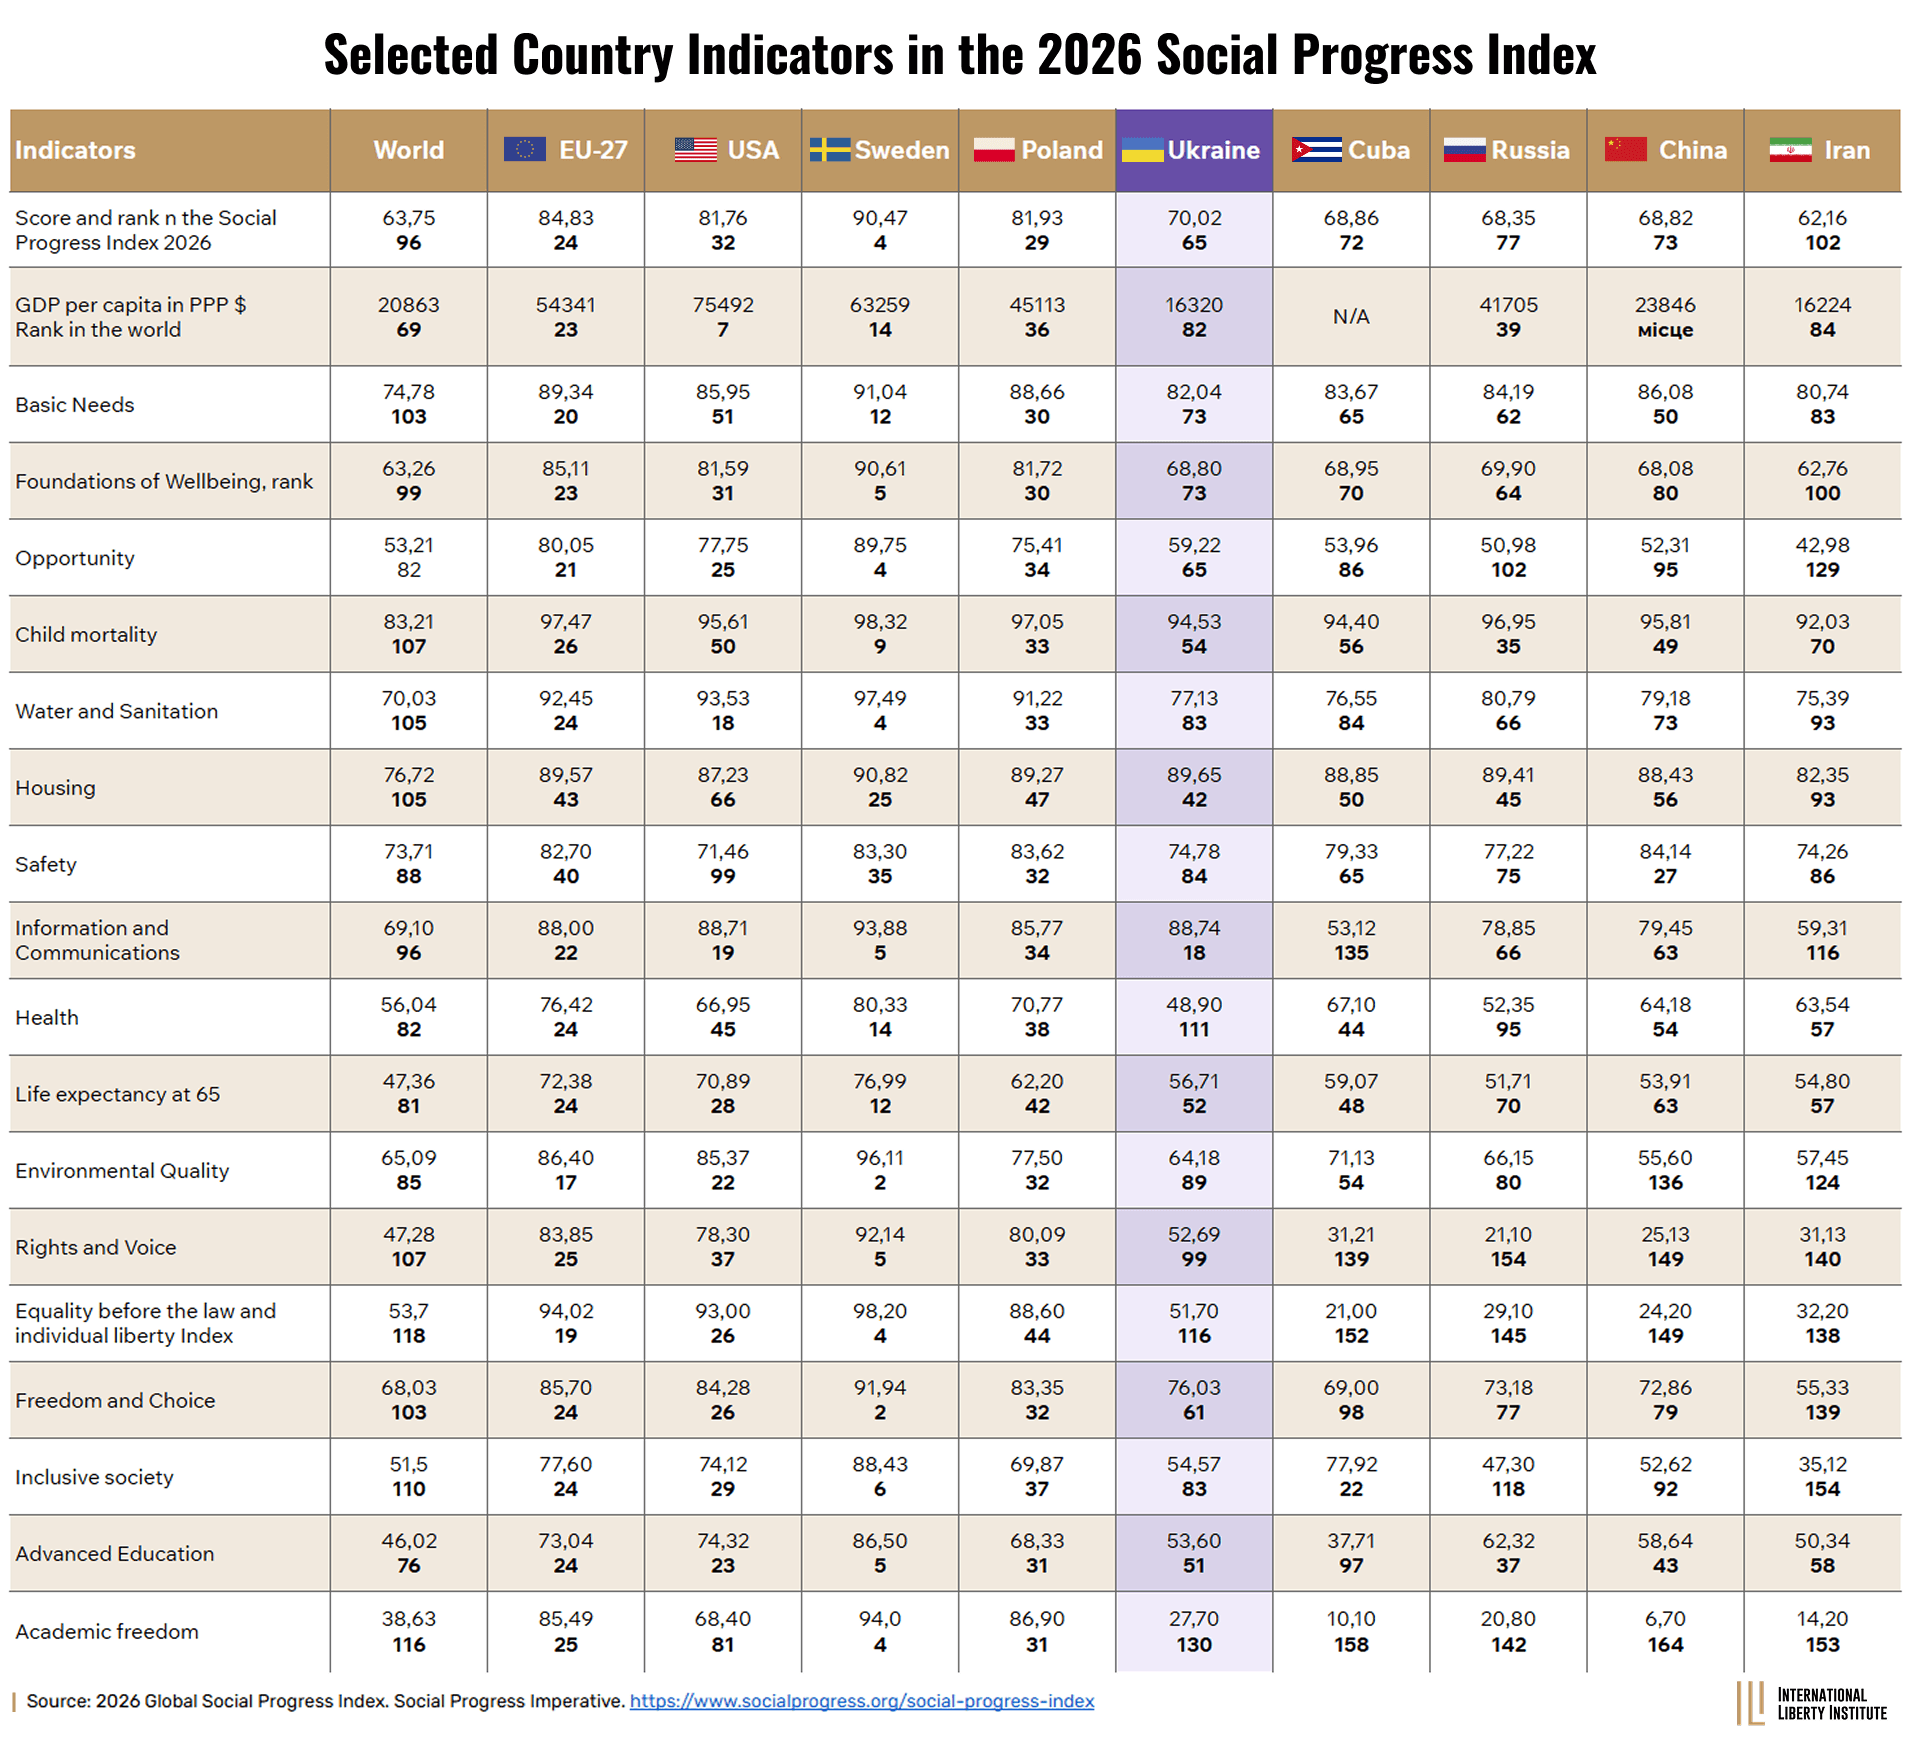
- On the “Housing” indicator, Cuba scored 88.85 points and ranks 50th in the world. By comparison, the United States scored 87.23 points and ranks 66th.
- In terms of “security,” the United States ranked 99th with a score of 71.46, while Cuba scored 79.33 and ranked 65th.
- In the “health” category, Cuba has a score of 67.1 and ranks 44th, while the United States, with a score of 66.95, ranks 45th.
- In the “environmental protection” category, Cuba scored 71.13 points (54th place), while the United States scored 85.37 points (22nd place). For comparison: China scored 55.6 points (136th place), while the global average is 57.96 points (121st place).
In other words, supporters of Cuban totalitarianism might say that, at the request of the people or society, they ensure fairly high standards of social development. By a number of indicators, totalitarian Russia and Belarus outperform dozens of democratic developing countries and even developed nations around the world.
Along with communist, totalitarian China—which, thanks to certain regions with a high degree of economic freedom, has achieved rapid, long-term economic growth—the theorists and ideologues of “Leviathan” cite these countries as examples of a development model that offers an alternative to the West.
Such indices are presented as scientific, meaning that their conclusions and recommendations can be trusted. They are actively used by international organizations and NGOs to advance their agendas, particularly in the areas of the environment, industry, innovation, and, of course, fiscal and regulatory policy. Such indices are based on supposedly scientifically proven hypotheses about global and national market failures, the need for government intervention to counter contemporary threats, and the optimization of capital allocation.
In fact, we have a whole set of propaganda and ideological tools that push the governments and elites of developing countries—which lack a strong intellectual and economic elite—to adopt a model of general interventionism.
The Global Gender Gap Index
Gender relations are a popular topic among theorists and ideologues of the model of the state of general interventionism. They have become part of the mandatory agenda of mainstream economics, alongside the notorious DEI/ESG agenda.
Theorists and advocates of gender equality argue that achieving it would increase global GDP by $2–5 trillion. This class-based approach is founded on a whole series of utopian assumptions and hypotheses, the implementation of which has negative consequences in both corporate and government management systems. Gender quotas, the separate assessment of men’s and women’s property rights, and the imposition of gender quotas on the composition of government bodies are manifestations of blatant discriminatory practices.
There is no such thing as "women's freedom" or "men's freedom". There is no such thing as women's or men's private property rights. It cannot be only “women’s rights matter” because “human rights matter.” There are numerous examples of dictators and authoritarian regimes cynically manipulating and pitting collective rights against one another, while pretending to embrace what “sells well” on Western platforms.
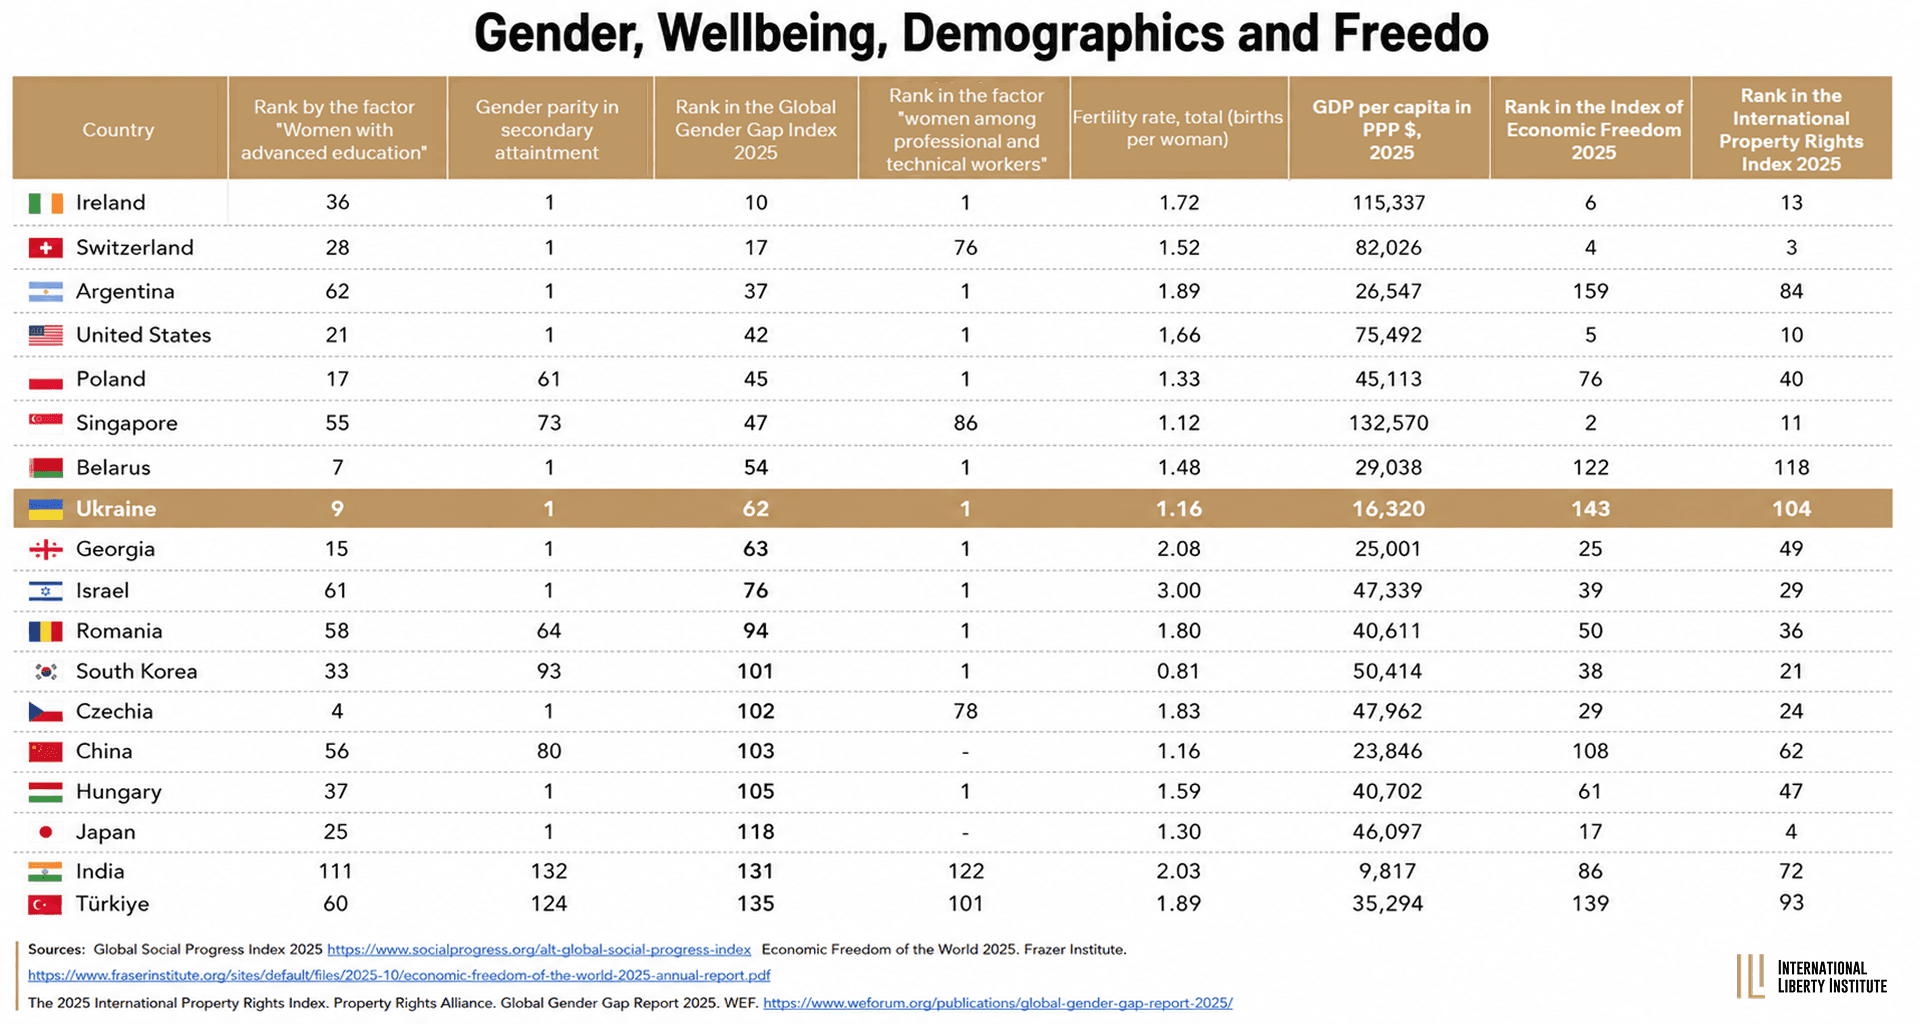
Is it really true that Belarusian women’s productivity, quality of life, and opportunities under a totalitarian dictatorship are higher than those of women in Israel? After all, in the 2025 Global Gender Gap Index, Belarus ranked 54th, while Israel ranked 76th? It is unlikely that women in Namibia (ranked 8th in the 2025 Gender Gap Index) feel better or more confident in the labor market or in corporate and government leadership than women in South Korea (ranked 101st), Japan (ranked 118th), or the Czech Republic (ranked 102nd). Do Singaporean women really suffer because their country ranks only 55th in the world in terms of “women with higher education” and 48th in terms of “gender equality in secondary education,” yet its GDP per capita (PPP) is nearly $133,000 per year? Singapore ranks second in the world in terms of economic freedom and 11th in the world on the Property Rights Protection Index.
Do women in Ukraine really receive any special support, status, or financial assistance simply because Ukraine ranks 9th in the world in terms of “women with higher education” and first in the world in terms of “women among professional and technical workers”? Corruption, abuse of power, and violations of property rights in Ukraine are gender-neutral. If a country with a large state disregards economic freedom and property rights, the balance between the beneficiaries and victims of such a political and economic model is not determined by gender. It breaks down as follows: 3% are the beneficiaries of the system — a syndicate of VIP bureaucrats — while the remaining 97% are the rest of the population.
What earned Argentina 37th place in the Global Gender Gap Index — above the United States, Poland, and many EU countries? What has the active presence of women with higher education in the workforce brought to this country if universities, state institutions, religion, and the cultural code are permeated by socialism, Leviathanism, and the principle of “take away and divide”? Moreover, this principle also prevails in the public education system. Despite such high levels of gender equality and widespread access to higher education for women, Argentina has fallen into a deep crisis, as a result of which Javier Milei became the country's president.
From the perspective of gender equality theorists, when a significant proportion of women with higher education participate in the governance of the country and in business, progress should follow, along with an acceleration in economic development and an improvement in the quality of life. There is no statistical or sociological evidence to support this hypothesis. What difference does it make what gender a judge, prosecutor, customs officer, or inspector is if they “terrorize” business owners, arbitrarily freeze accounts, take bribes, and “sell” their right to interpret the law (discretion)? What good is it that the vast majority of teachers in the secondary education system are women if young people with high school diplomas don’t know the basics of economics and don’t understand the essence of freedom and entrepreneurship? Ignorance, opportunism, corruption, narcissism, vanity, envy, and the principle of “putting one’s own interests first” are gender-neutral. If it were otherwise, the numerous indices, rankings, and qualitative indicators of economic development would clearly point to that.
For women to flourish, to be able to fully realize their potential, and to live harmonious and balanced lives, men and women must promote the principles of capitalism and free enterprise.
It was capitalism that radically changed the status of women in the economy. It is entrepreneurs, through their remarkable technologies, who have created unprecedented opportunities for them to produce goods and services. Women's organizations that focus on "taking away and dividing" — that is, on increasing the size, functions, and resources of the state — act against women's well-being. Socialism, Nazism, and totalitarianism — whether they take on a masculine or feminine form — degrade human beings and increase the risks of poverty, injustice, and the extinction of a nation. That is why the World Economic Forum’s Global Gender Gap Index, which ignores these factors and aspects of economic development, serves as a tool for promoting certain theories and ideological constructs that have nothing to do with economic science.
Economic Complexity Index
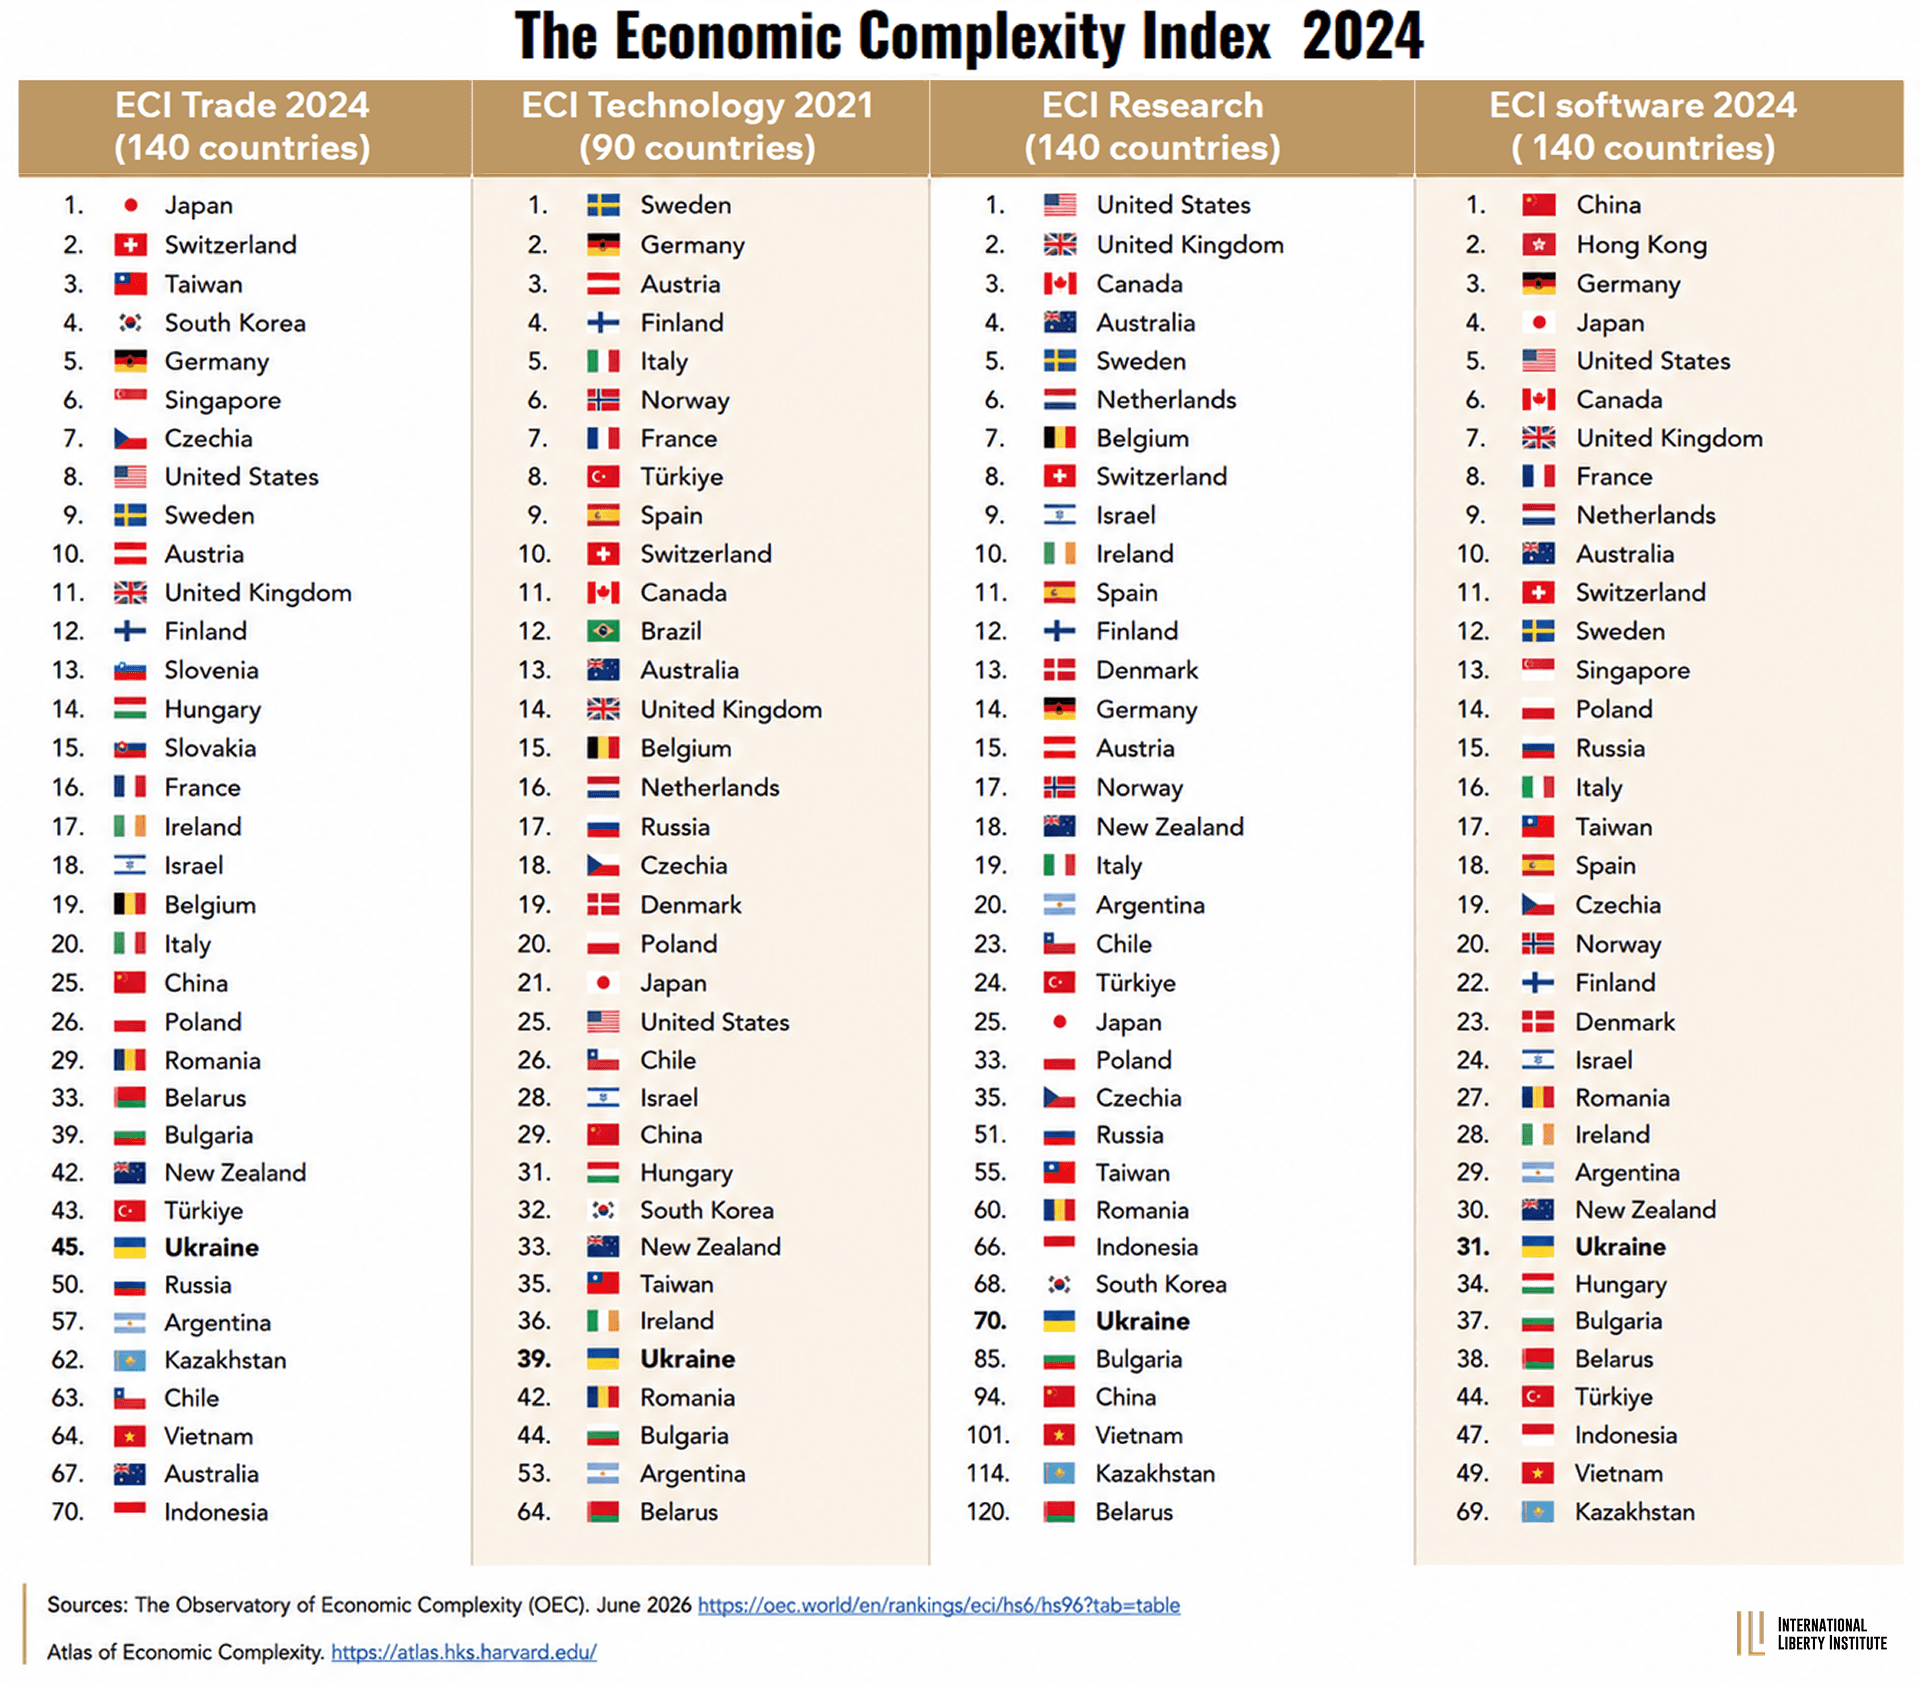
The Economic Complexity Index ranks countries based on the diversity and complexity of their export products, rather than on the volume of their exports. Experts assess the level of complexity and give higher ratings to complex, high-tech goods whose production requires a workforce with the appropriate level of training, skills, and knowledge. In other words, a skilled, competent workforce produces complex goods that are sold abroad. So, that's a good thing.
Complexity is assessed based on four indicators:
- trade flows (ECI Trade);
- patents (ECI Technology);
- scientific publications (ECI Research);
- employment in the software industry (ECI Software).
The Atlas of Economic Complexity is a data visualization tool that, according to experts at the Harvard Kennedy School of Government, “allows people to explore global trade flows across markets, track these dynamics over time and discover new growth opportunities for every country.” It uses the statistical data underlying the Economic Complexity Index. The theoretical assumptions and hypotheses underlying the Index are as follows:
- The more complex an economy is, the greater its chances of achieving rapid, long-term, sustainable growth, increasing labor productivity, attracting investment, raising incomes, and creating high-productivity jobs;
- The government, or analytical, consulting, and research organizations acting on its behalf, can identify potential “growth areas” of the national economy based on statistical databases;
- The government and the commercial organizations it authorizes, based on information from their Economic Complexity Index, can mobilize various forms of capital to produce goods they consider to be potentially promising and profitable, to ensure sustainable, inclusive, and “green” economic growth;
- The government acts as a buffer against yet another market failure, as private commercial entities are unable, without state involvement, to identify so-called “growth areas” and promising technologies of the future. The government organizes commercial “missions,” bringing together a wide variety of capital forms, and acts as a driver of innovation (M. Mazzucato’s theory).
- The government assumes that import substitution is a better and more effective means of ensuring rapid, long-term economic growth than integration into the international division of labor and into global/regional value chains.
- The government proceeds from the assumption that it knows: certain sectors, by definition (e.g., the IT sector), are strategically more promising and ensure higher, long-term rates of economic growth.
- The government believes that the main obstacle to industrial development and the launch of domestic production is a lack of knowledge about markets, rather than a lack of skills, experience, manufacturing know-how, or entrepreneurial capital, as well as a poor regulatory and macroeconomic environment.
- The government believes that tax breaks, preferential treatment, subsidies, and the selection of favored industries from among general market conditions will have a neutral effect on the market structure of capital and employment.
All of these hypotheses and assumptions of the Economic Complexity Index stem from the very nature of the welfare state model, with its neoclassical, mainstream, positivist assertions about market failures, perfect competition, public goods, and the ideal state. According to the theorists and ideologists of this model, it not only “scientifically” defines the “social optimum,” “balanced development,” and “balance of interests at the global and national levels,” but also seeks to eliminate poverty, inequality, injustice, and even environmental pollution.
The authors and developers of the index state:
L"We then validate and select a separate ‘multidimensional model’ for growth, inequality, and emission intensity using the following criteria. First, the multidimensional model must lead to the largest significant increase in explanatory power over the baseline model (given by the coefficient of determination adjusted-R² and validated by a Wald F-test). The baseline models are defined in each respective section. Second, in the multidimensional model, all included complexity coefficients (individual and interaction terms) must be statistically significant, considering clustered standard errors. Finally, we require the model to pass two types of robustness checks.
First, we check for robustness by exploring whether the effects hold after including additional variables. These are measures of size (population), human capital (years of education), dependence on natural resources (natural resource exports per capita), and metrics of the intensity of each respective output (exports per capita, patent applications per capita, and the number of research documents per capita)."L
First, we check for robustness by exploring whether the effects hold after including additional variables. These are measures of size (population), human capital (years of education), dependence on natural resources (natural resource exports per capita), and metrics of the intensity of each respective output (exports per capita, patent applications per capita, and the number of research documents per capita)."L
Source: Multidimensional economic complexity and inclusive green growth. Viktor Stojkoski, Philipp Koch & César A. Hidalgo. 2023 https://www.nature.com/articles/s43247-023-00770-0
From their perspective, the use of economic complexity indicators is effective because they reflect
L"information about productive structures that escapes simple aggregate metrics, such as GDP or market concentration indexes. Unlike these metrics, which aggregate values regardless of the activities involved, economic complexity metrics capture information about the sophistication of activities that is implicit in their geographic distribution. For instance, according to a market concentration index (such as the Herfindahl–Hirschman index or information entropy), a country that exports 80% bananas and 20% cars is the same as a country that exports 80% cars and 20% bananas. Economic complexity metrics break this symmetry by incorporating information about the sophistication of each activity that is implicit in spatial patterns of specialization."L
Source: Multidimensional Economic Complexity: How the Geography of Trade, Technology, and Research Explain Inclusive Green Growth. Viktor Stojkoski, Philipp Koch & César A. Hidalgo. Papers in Evolutionary Economic Geography. # 22.28. Utrecht University. http://econ.geo.uu.nl/peeg/peeg2228.pdf
The authors of the Economic Complexity Index — a methodology for assessing economic development — openly state that it is an important tool for explaining and ensuring inclusive “green” economic growth. In other words, pseudoscientific assumptions are initially taken as given — namely, that economic growth must necessarily be “green,” in accordance with the climate imperatives of the Kyoto Protocol and the Paris Agreement, as well as inclusive, that is, it must meet DEI/ESG requirements. This means that econometric modeling is carried out using highly aggregated measures — indicators that are disconnected from the dynamics of change and from the actual parameters of the business environment in which economic agents make decisions.
The very concept of “complexity” leaves ample room for interpretation and manipulation. “Complexity” — like “optimality,” “expediency,” “sustainable development,” “inclusive growth,” or “equitable distribution” — requires methodological, technocratic, and legal clarifications, instructions, terms, and provisions. Their development, adoption, and implementation represent a separate regulatory burden. And the costs translate into additional taxes for consumers, reduced opportunities for low-margin businesses, and a stronger incentive to shift economic activity into the “shadow economy.”
Implementing the recommendations of the Economic Complexity Index requires active government intervention and the use of monetary, fiscal, regulatory, trade, and administrative policy tools. As is well known, they distort the market structure of capital, shrink the fully functioning market sector, and increase the level of state control over the economy. Thus, the Economic Complexity Index is yet another tool for pseudoscientific justification of state interventionism in industry, innovation, and trade, aimed at artificially ensuring this very complexity of the economy through a specific set of government policy measures.
Japan is the global leader in the Economic Complexity Index for 2024 (these are the latest figures as of mid-2026).
Japan's share of global GDP was 2.6% in 1913, 3.0% in 1950, and 7.7% in 1998. In 2025, Japan's GDP was $4,435 billion, accounting for 3.8% of global GDP. For comparison: Japan's GDP in 2000 was $5,041.4 billion, or $39,756.6 per capita. Among developed countries, Japan has posted some of the lowest rates of economic growth. At the same time, it significantly expanded the public sector and strictly adhered to the principles of inclusive, “green” economic growth.
Australia. In 2000, the country's GDP was $401 billion, or $20,952 per capita. In 2025, Australia's GDP reached 1,840 billion dollars, or 66,351.8 per capita. At the same time, Australia ranks 33rd on the Economic Complexity Index. While in 2000, Japan's GDP per capita was 90% higher than Australia's, by 2025 Australia had surpassed Japan by 84% in this regard.
Vietnam, which ranks 90th in the 2024 Economic Complexity Index, has demonstrated very high rates of economic growth over the past 25 years, radically improving virtually all of its economic and social indicators. In 2000, Vietnam’s GDP was $39.6 billion ($499 per capita). In 2025, GDP reached $494 billion, or $4,829 per capita. In other words, between 2000 and 2025, the country's GDP increased 12.5-fold in dollar terms! Per capita GDP increased 9.7-fold. It should be noted that total government spending in Vietnam amounted to 17.8% of GDP in 2000 and 22.2% of GDP in 2025.
Conclusions
There are numerous examples showing that the recommendations and conclusions derived from the Economic Complexity Index lack a sound foundation. However, the UN, numerous development agencies, and consulting organizations actively promote and offer it to developing countries and countries with economies in transition as a tool for shaping economic, industrial, and foreign trade policies. Meanwhile, the WEF, the IMF, the World Bank, and the OECD continue to apply cancel-culture tactics to other indices that, for more than 30 years, have consistently demonstrated a clear relationship between economic freedom, property rights protection, and such indicators as economic growth, the rule of law, poverty, child mortality, innovation, and more.
Among the indices that support the free-market theory and the unconditional superiority of the entrepreneurial growth model are the Index of Economic Freedom from the Canadian Fraser Institute, the Index of Economic Freedom from the U.S.-based The Heritage Foundation and the International Property Rights Index from the Property Rights Alliance. These are precisely the indices that the International Liberty Institute uses in its analytical research, including the Economic Security Index and the Common Sense Economics Index.
Every researcher and every scientific and analytical organization has the right to experiment with a wide variety of data, study statistics and surveys of experts and the general public, organize this data according to various criteria, and formulate hypotheses based on their research. Given the growing popularity of a wide variety of indices, politicians and the intellectual and scientific communities in Ukraine, as well as in developing countries, should be very cautious about such indices and the recommendations formulated on their basis, especially if they are presented as supposedly scientific evidence of the effectiveness of the State in the economy.
Share
Topics
World Indexes & Rankings
Yaroslav Romanchuk
A well-known Ukrainian and Belarusian economist, popularizer of the Austrian economic school in the post-Soviet space. He specializes in reforms in transitional economies in the post-socialist space.